A dashboard shows zero open findings. Did the assessment complete, or did no results arrive? If the screen cannot distinguish those states, the number cannot support the decision.
The same digit can mean “we looked and found nothing” or “we did not look,” and a reader who cannot tell which is holding an opinion, not a measurement.
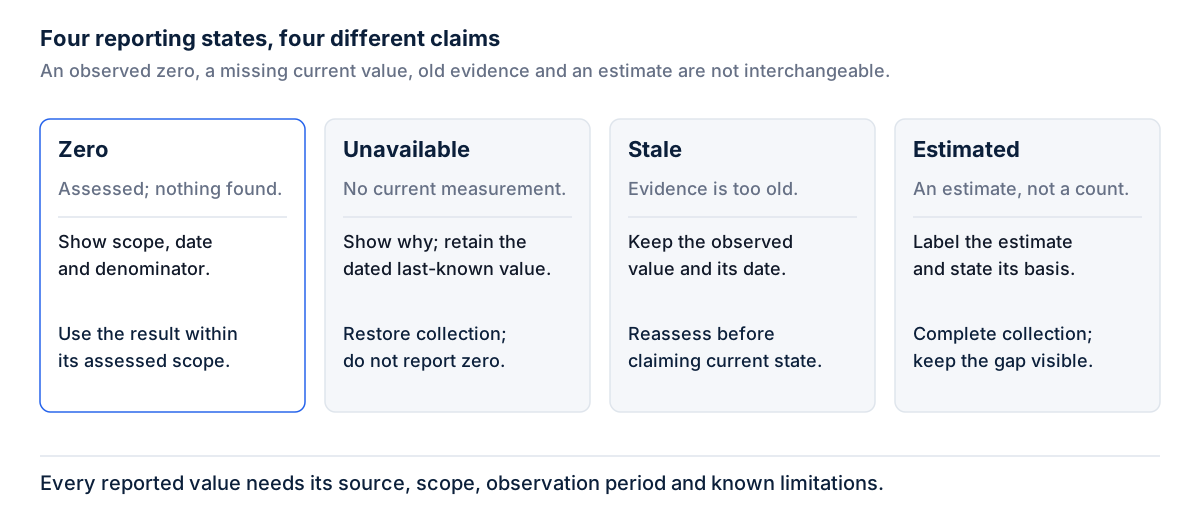
Four states that render as one
Consider a hypothetical vulnerability management dashboard with a findings tile, a coverage gauge, a scan status indicator and a trend line.
The findings tile reads “0 open findings” for a network segment. If the scanner reached the segment and reported nothing, that is a result. If the scanner was never pointed at the segment, or failed to connect, the same query returns the same zero. Nothing on the tile separates the two cases.
The coverage gauge reads 100 percent. The denominator is the set of assets registered in the tool. The percentage describes coverage of the registered inventory; it does not establish completeness of that inventory. A segment nobody registered is excluded from both sides of the fraction.
The scan status reads “running, 62 percent.” Suppose the scan engine stopped reporting forty minutes ago. The interface shows the last value it received, and the reader cannot know it is stale.
The trend line runs smoothly across a two-week gap in collection. The charting library interpolated, and the viewer sees a stable posture during a period in which nothing was measured.
In each case the value could be observed, stale, unavailable or estimated, and the screen renders all four the same way. None of this is deliberate. A widget needs a value, the value is not available, and the case for “not available” was never designed.
Why the distinction matters
People act on the number. A vulnerability manager who sees zero findings moves on. One who sees “scan not executed” opens a ticket. The two screens differ by one sentence, which is the difference between a known gap and an unknown one.
Reports inherit the number. Once a dashboard figure is copied into a management report or an evidence pack, it is read as a measurement. If it was never one, the organization has attested to something it did not observe, and nobody downstream can tell.
NIST SP 800-137, the federal guideline on information security continuous monitoring, grounds the program in current and accurate security-related information reaching the people making risk decisions (NIST SP 800-137). It does not say how a dashboard tile should look. It does make clear that a monitoring program is only as good as the currency and accuracy of what it reports, and an untraceable zero fails both tests.
Say what you do not know
The corrective principle is short: when the system does not know something, the screen says so, and says why.
A scanner that cannot be reached is shown as unreachable, with the last state it reported and when. “Scanner unreachable since 13:51, last known progress 62 percent” and “running, 62 percent” contain the same digits and make different claims.
An estimated time is labeled as an estimate. “Next assessment approximately Tuesday” and “Last assessed 14:32:07” should look different, because one is a schedule and the other a recorded event.
A metric that cannot be computed is absent rather than guessed; rendering zero percent claims a number nobody has. The honest rendering names the reason: not yet collected, source offline, outside configured scope.
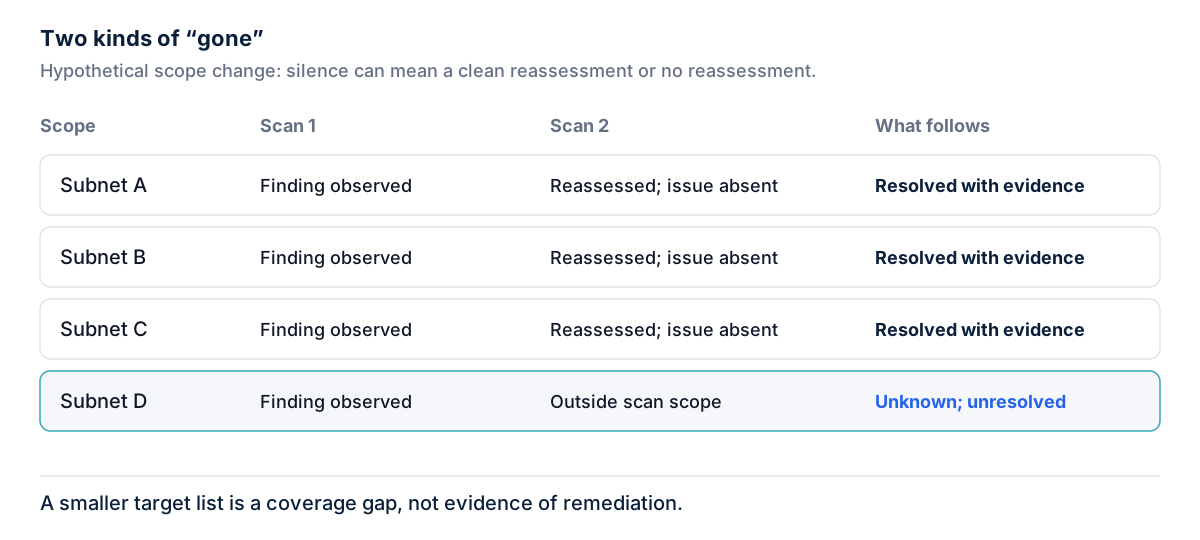
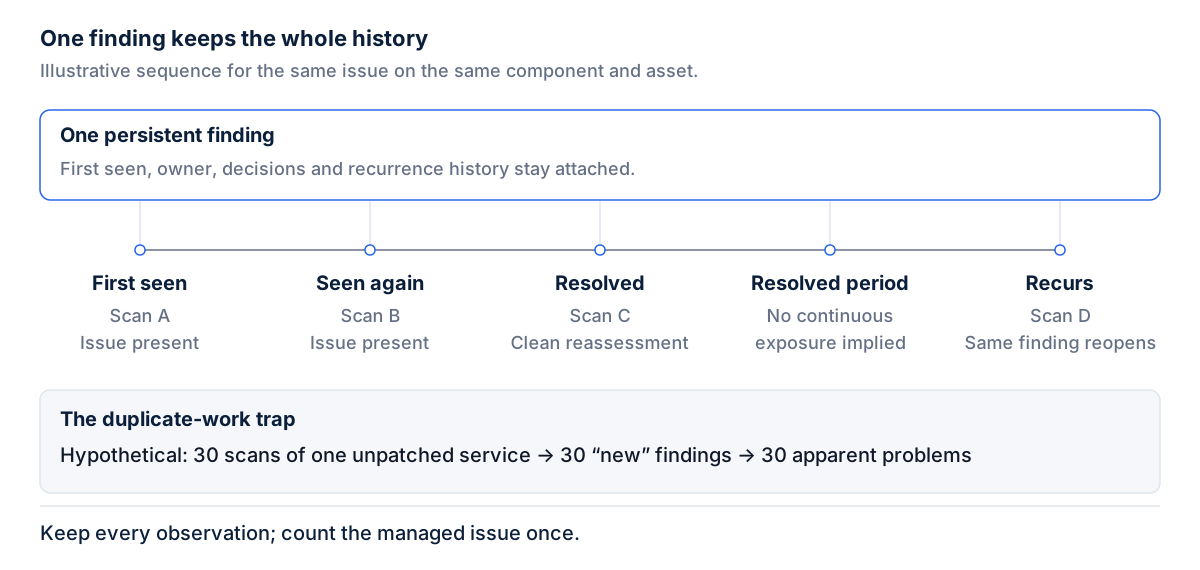
A finding that stops appearing retains its history and existing decision; missing output alone establishes neither resolution nor risk acceptance. The observations behind it are evidence, and the case for keeping one living finding with every observation attached is made in One finding, every observation.
A worked example
Suppose a hypothetical third-quarter management report contains a table of four scopes, with the reporting states made explicit.
Scope A, the office network: 0 open findings. Assessed 28 September, 412 of 412 registered assets reached, 3 findings resolved during the quarter, 0 risk accepted. This zero is a result; the denominator, the date and the resolution history are present.
Scope B, the manufacturing segment: not available. Scanner unreachable since 11 September; last completed assessment on 2 September reported 14 open findings. The report shows neither zero nor 14 as current. It shows the last known value with its date and says the scope is presently unobserved.
Scope C, the development environment: 7 open findings, stale. Last assessed 3 June, before the quarter. The count is real, but the reader is told it predates the reporting period.
Scope D, a newly acquired subsidiary: coverage estimated. Inventory import in progress; 180 assets registered of an estimated 300. No findings count is reported, because no assessment has run. The estimate is labeled and its basis stated.
Only Scope A supports a measured zero within its stated assessment scope; that does not establish that no other security work remains. The other three call for different actions: restore the scanner, reassess, finish the inventory. A table that rendered all four as a bare number would have supported none of them.
The fourth question
Vulnerability dashboards are usually designed around three questions. What should we fix first, and why? Who owns it? What did we resolve, with proof?
The distinction above adds a fourth: what do we not know right now?
Which scanners are unreachable. Which assessments did not finish. Which scopes have never been assessed, or not within the reporting period. This question carries as much weight as the first three, because a dashboard that cannot display the unknown displays it as nonexistent, and the other three answers inherit that blind spot.
Designing for it changes the layout. Unknowns get a place on the main screen rather than a buried log. Every aggregate carries its denominator and its freshness. Every status indicator distinguishes observed from assumed.
Traceability for review
Auditors and internal reviewers ask one question of a reported figure: where did it come from? Our recommendation, independent of any framework: for each reported metric, retain its definition, scope, observation period, source and known limitations so another reviewer can reproduce its meaning. A number with those attributes can be checked; one without them can only be believed.
Documented gaps are defensible. “Scope B was not assessed after 11 September because the scanner was unreachable; here is the reassessment date” is a statement a reviewer can work with. An unlabeled zero for the same scope asks the reviewer to take an absence of data as assurance.
In practice
Four questions to ask before a dashboard number reaches a report:
- For this number, can I see the source, the scope, and the time it was observed?
- When a scanner is unreachable, what does this screen show, and how quickly does it change?
- What is the denominator of this coverage figure, and what is excluded from it?
- Where on this screen can I see what the organization does not currently know?
Sectie’s Exposure & Vulnerability Management product is built on this rule: every number on screen comes from real data, estimated values are labeled, and the unknown is shown as unknown.