Suppose a security lead is asked how the vulnerability program is doing and reports 340 open findings, down from 410. The question that number cannot answer is how much of the estate it describes. If the scanner reached half the assets, the count describes half the estate. If it reached them without credentials, it describes their network surface. Coverage is the measurement that tells a reader what the findings count is a count of.
Why open findings are not a coverage metric
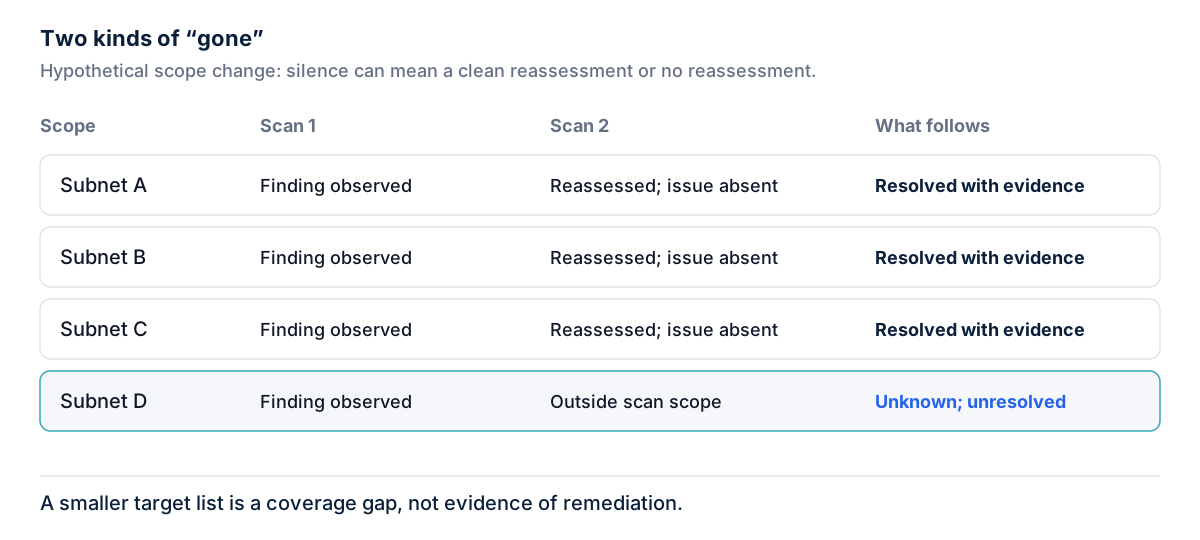
A findings count has only a numerator. It goes down when issues are fixed, and it also goes down when assets stop being scanned, when credentials expire, or when a scan job fails halfway. The companion article on closure covers the record-level version of this problem. At the program level the effect is the same: a falling count is ambiguous until coverage is reported beside it.
NIST SP 800-40 Rev. 4 makes a related point about measurement quality. Collecting data through unauthenticated rather than authenticated scans, it says, “will generally underreport vulnerabilities and thus skew the higher-level metrics” (p. 18). Fewer findings from a narrower view is not an improvement.
The denominator problem
Asset coverage is a fraction, and its denominator is the asset inventory. That makes inventory quality a precondition rather than a separate project. CIS Controls v8 places “Inventory and Control of Enterprise Assets” first, and Safeguard 1.1 asks for an “accurate, detailed, and up-to-date inventory of all enterprise assets” (CIS assessment specification, 1.1). Control 7, Continuous Vulnerability Management, depends on it: the assessment specification for Safeguard 7.5 defines scan coverage as “The percentage of internal assets covered by a vulnerability scanner”, calculated against the count of internal assets from that inventory (CIS assessment specification, 7.5).
SP 800-40 Rev. 4 is realistic about completeness. It describes the practical goal as a “close-to-comprehensive inventory” maintained by automated discovery (p. 10). The inventory will never be perfect, which is a reason to report its source and age with the coverage figure, not a reason to measure coverage against a smaller list.
Coverage metrics with precise definitions
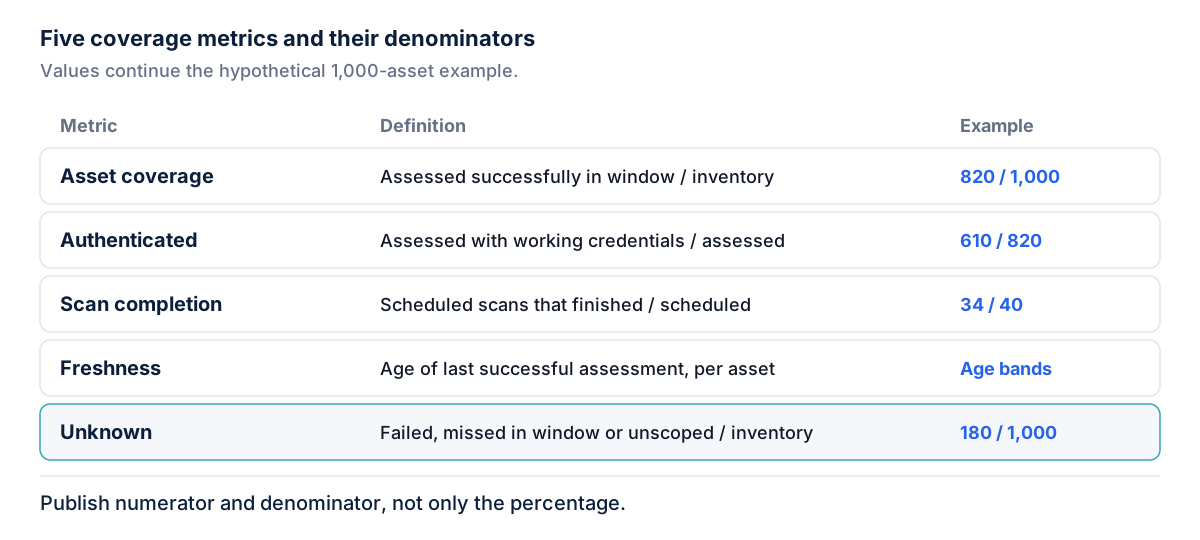
Each metric below has a fixed numerator, denominator and time window. Publishing the counts alongside the percentage lets a reader check the arithmetic.
Asset coverage. Assets with at least one successful assessment within the reporting window, divided by assets in the inventory. “Successful” means the scan engine reached the asset and ran its checks to completion; a scan that stopped partway, or an asset only listed as a target, does not count. Where an asset had both failed and successful attempts in the window, the successful one counts and the failures go into scan completion.
Authenticated coverage. Assets assessed with working credentials, divided by assets assessed. Some teams divide by the full inventory instead, as the CIS specification does; either works if the denominator is stated. An asset where the login failed but the network checks completed counts as assessed unauthenticated, not as authenticated.
Check coverage. For a given asset class, whether the checks able to detect the issues that matter actually ran. A host can be authenticated and still miss local checks if the relevant plugins were disabled or do not apply to its platform. It is harder to reduce to one number, so it sits outside the table below, but it belongs in any review of an asset class that reports suspiciously few findings.
Scan completion rate. Scheduled scans that finished, divided by scans scheduled in the window. It measures the machinery rather than the estate, and it explains drops in asset coverage before they become a surprise.
Coverage freshness. The age of the last successful assessment for each asset, reported as a distribution or in age bands rather than an average. An estate fully assessed once, two months ago, has zero asset coverage in a 30-day window; freshness shows that the gap is staleness, not an estate the scanner has never seen.
Alongside these, unknown is a reported state, not a remainder. Assets whose scans failed or were incomplete, assets in scope but not scanned in the window, and assets never in any scope are counted and shown. The case for showing gaps rather than filling them is made in What does zero findings actually mean?
Pitfalls that inflate coverage
Shrinking the denominator. The easiest way to raise asset coverage is to remove assets that are hard to reach from the reference population: offline laptops, a segment the scan engine cannot route to, a cloud account nobody connected. Coverage rises while the estate is unchanged. Exclusions should be explicit, listed and counted, never silent.
Counting a failed-authentication scan as coverage. The scan ran, the host answered, the credentials were rejected. That is coverage of the network surface only. Counting it as authenticated coverage hides exactly the gap SP 800-40 Rev. 4 warns about.
Counting a first run as full coverage. A newly created scan job that has run once has produced a baseline, not a history. Freshness and completion over several windows matter before its results support trend claims or closure decisions.
How to report coverage
Put coverage next to findings on every dashboard and in every report that carries a findings count. A findings tile without asset coverage and unknown beside it invites the wrong reading.
Trend the unknowns. A falling findings count with a rising unknown count may still include real remediation, but the findings count alone cannot show it, so the drop cannot be claimed as progress.
Slice by owner and segment. An estate-wide 82 percent can hide a segment at 30 percent, and owners act on their own slice. CISA’s Binding Operational Directive 23-01, which applies to federal civilian executive branch agencies, sets a fixed cadence for discovery and enumeration and frames oversight in terms of “scanning cadence, rigor, and completeness”. The terms carry over well: how often, how deep, how much.
A worked example
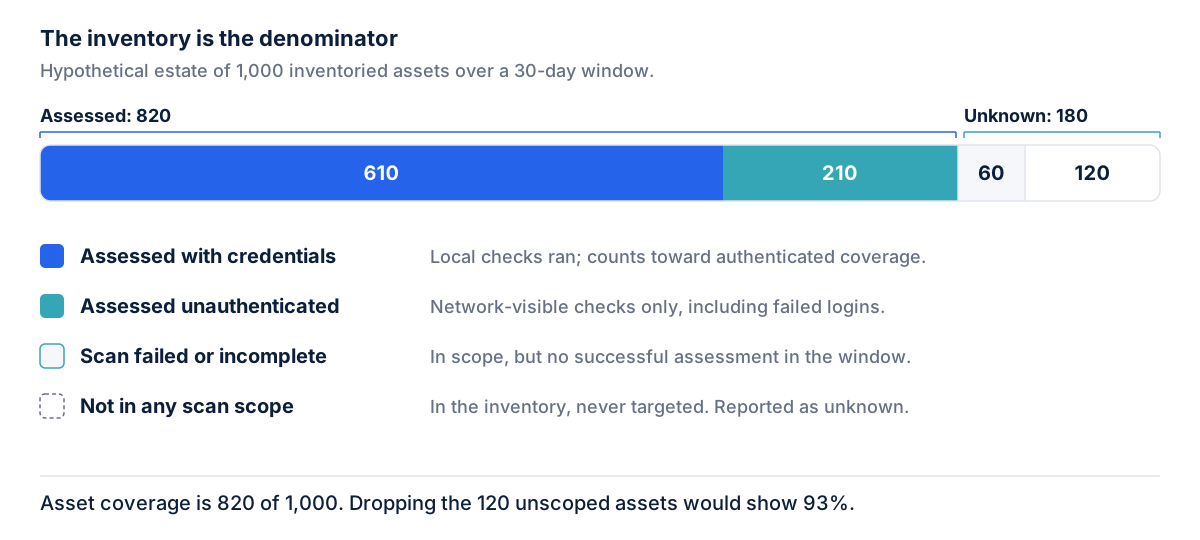
The numbers here are hypothetical. An organization has 1,000 assets in its inventory and reports on a 30-day window. In that window, 820 assets had a successful assessment, 610 of them with working credentials. Another 60 were in scope but every scan against them failed or stopped early, and 120 were in the inventory but in no scan scope. Of 40 scheduled scans, 34 finished.
Asset coverage is 82 percent (820 of 1,000). Authenticated coverage is about 74 percent of assessed assets (610 of 820), or 61 percent of the inventory. Scan completion is 85 percent. Unknown is 180 assets, 18 percent of the estate.
If the 120 unscoped assets were quietly removed from the denominator, asset coverage would read 93 percent with nothing scanned differently. The honest report shows 82 percent, names the 180 unknown assets, and lists the owners of the 120 that no scan targets.
In practice
- State the inventory source and its date next to every coverage figure.
- Publish numerator and denominator, not only the percentage.
- Count failed-authentication assets as assessed unauthenticated, and report them separately.
- Report unknown as a number with a trend, and list the assets behind it by owner.
- Report freshness as age bands per asset, not as one average.
- Treat any change to scan scope as a change to the coverage report, and record it.
Sectie’s Exposure & Vulnerability Management product reports coverage alongside findings, showing which assets were assessed, with what access, and which were not.